


#20: The Case for the IUL: Increasing the equity allocation of your portfolio while reducing taxation and volatility
Giving up short-term return to reduce volatility and taxation ends up being a long-term win for clients in high tax brackets who know what they are doing

We often think growth is linear.
You see it plastered across everything from motivational speeches (“If you just improve 1% a day….”) to personal finance memes (If the S&P500 does 10% every year, then that means in 30 years….).
And I get it.
It’s tough to distill complex concepts into easily digestible content.
I say this as someone who consistently does Monte Carlo simulations (warning, if you don’t like reading about Monte Carlo simulations this article is about to get a lot worse) and then tries to write about them in 3,000 word missives all while wondering if there isn’t a simpler way to convey the same message.
And yes, there is a simpler way.
And that simpler way is to create personal finance memes about how much money you’ll have if you invest in the market for 30 years and the market makes 10% every year or buy an IUL product that makes 6% every year.

There is tremendous value in simplicity.
Simplicity gets a lot more people to move in the right direction that otherwise wouldn’t have if you hadn’t simplified the message enough to get them to move.
That applies equally to the couch potato finally deciding to go to the gym in order to try and be 1% better each day as well as the individual who finally decides to start learning about and investing in the market after seeing an Instagram meme.
Complexity won’t win these individuals over. If anything it will overwhelm them and make them not want to do anything at all.
So the problem isn’t with trying to simplify messages that are directionally correct even if you remove the nuance.
The problem is when you try and simplify messages in which leaving out the nuance and complexity ends up hurting a lot of people in the process.
Of all the financial products on the market, I see this the most with Indexed Universal Life (IUL) products
An IUL at its core is simple.
It creates a solution for the fact that in real life growth doesn’t happen in a linear fashion. It happens directionally over time while in the short-term you can observe large losses and large gains.
And by reducing the large short-term losses AND eliminating the taxation of those gains, we can create a higher risk-adjusted return—and in some cases a higher absolute return.
The problem is that this volatility control chassis is built within a complex framework that very few people actually understand how to use properly.
In fact most people don’t.
And yet they purchase the product anyways because the people who sell them do a great job of leaving out the complexity of the product in pursuit of making a sale.
And what happens then is that the people who buy them eventually end up canceling them and then losing everything they invested into the product because they didn’t know what they were getting into or how to use this new shiny thing they just bought.
Which of course leads them to conclude that the IUL is a horrible product, and that all people who sell them are horrible people, and that no one should ever touch it.
This of course is a simple answer that leaves out the nuance.
So in essence, they’re guilty of engaging in the same behavior that the “horrible” salespeople who sold them the product did.
Such is life and humanity.
The truth of the matter is that it is a complex product they should never have touched for the simple reason that they had no idea how to separate the good IUL products from the bad ones and even if they did, would have had no idea how to use it as a financial planning tool. Nor would it have even really applied much because they were in too low a tax bracket for it to even matter.
But for people in high tax-brackets, the right IUL product allows them to increase their equity allocation to a higher allocation than they normally would without adding the higher volatility that comes from equity risk.
This ultimately leads to greater wealth creation than a portfolio with a lower equity allocation—especially one that is using tax-inefficient bonds as a means to reduce volatility in the portfolio.
Improving Risk-Adjusted Portfolio Returns by Taking Part of the Bond Portfolio and Allocating it to an IUL

Understanding the Cost of Volatility in a Portfolio
If we take a look at the annual S&P total returns from 1928-2024 the average annual return is 11.60%. However, the compound annual return from 1928-2024 during that period is 9.79%.
Why is multiplying the returns consecutively over that period (i.e. the compound annual growth return) so much less than just adding up the returns and dividing it by 97 (the years in the sample period)?
The answer is due to volatility drag.
We’ve covered this in a previous post.
But the idea is that two choices may have the same average return, but over time the one with the more volatile return will result in lower long-term returns.
Here’s a quick example:
Let’s say you have two investment choices. Both have a mean return of 10%. But one either returns -30% or 50% (for a mean of 10%) and other returns either 9% or 11% (again for a mean of 10%).
So the first investment option has a large spread between the highs and lows of the investment options. This spread is referred to as volatility.
The compound return of the first is significantly less than that of the second:
Table 1: Mean vs Compound Annual Returns
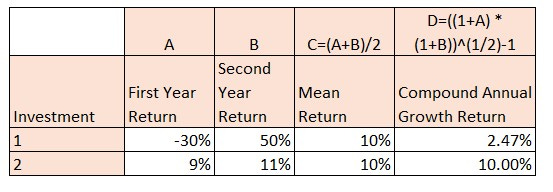
Let’s do a quick overview of the compound annual growth calculations for Investment 1:
Step 1: (1+ -0.3)*(1+0.5)=1.05
Step 2: (1.05)^(1/2)-1 = 2.47%
When we do the same calculation for Investment 2, the compound annual growth rate remains more or less equal to the mean (10%) because the difference between the two return possibilities (9% and 11%) is small.
In other words, the high volatility of Investment 1 kills the long-term returns even though it has the same mean return of Investment 2.
This is why when we look at stock returns from 1928-2024 the mean return is 11.60% but the compound annual growth return is only 9.79%.
The volatility embedded in stock returns has cost the long-term investor almost 2% in long-term returns in relation to its average annual return.
In order to reduce this volatility drag and diversify equity risk over the long-term, part of the portfolio is traditionally allocated to bonds—particularly as you get closer to retirement and making withdrawals.
Table 2: Stock and Bond Returns 1928-2024
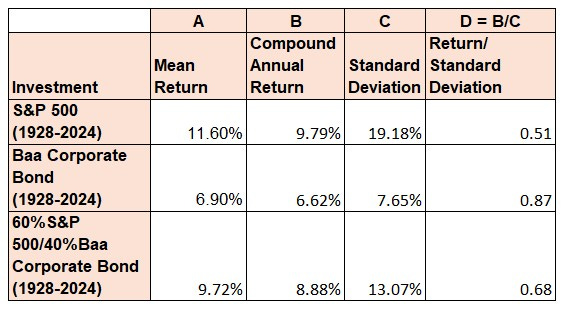
In the table above we can see that the least volatility drag between the mean annual return (Column A) and the Compound Annual Return (Column B) is the Corporate Bond as it has the lowest standard deviation (a measure of volatility) (Column C) and the highest return relative to risk (Column D).
However while bonds have the highest risk-adjusted return (Column D), their absolute return (Colum B) is still 300 basis points below stocks.
So in order to capture both the higher return of stocks and lower volatility of bonds a portfolio typically consists of a blend of both.
In the table above we see that the 60% Stock and 40% bond portfolio has a lower return than that of the stock only portfolio but also lower risk profile.
So for investors purely concerned with absolute return, a 100% stock portfolio may make sense.
But for investors looking to maximize the risk-adjusted return of their portfolio instead of just the absolute return, adding bonds to the portfolio can help accomplish this goal.
The problem with this approach is that bonds (in addition to the lower long-term returns) are that they are hugely tax-inefficient. For investors in states with high income taxes, you could be losing close to 50% of your gains here. And there is no opportunity to defer the taxation here in the same way you can with stock gains.
Almost 100% of bond gains over the long-term are realized in the year they are earned. Which means you pay high ordinary income taxes in that year.
This defeats any value of using bonds in this fashion for clients who are in a high tax-bracket both pre and post retirement.
So how do I improve my risk-adjusted return here in the absence of using bonds?
What if there was a way to keep investing in equities in order to capture the higher risk-premium and tax-efficiency of equities but give up some of the short-term return in order for reduced volatility which should lead to higher long-term returns?
Well, that’s where the IUL comes into play.
The Case for the IUL:
Let’s assume you only want to invest in the S&P500, but you don’t want the full volatility and investment risk that comes from doing so and I come to you with a trade:
I will allow you to invest in the S&P500 indirectly via at the money call options. That way if the market goes up you capture the price return above current market price. This of course means you’ll lose out on the dividend return of the S&P500 return (~1%-2% of the return currently).
I’ll also protect you against the downturns in the market by buying at the money put options. That way if the market goes down from today’s value you’re also protected.
So you’re getting the upside here when the market goes up, and protection against the market when it goes down.
However, I have to pay for this somehow.
I’m going to do this by selling out of the money call options above today’s current market value of the S&P500.
So that means you’re not going to get all of the value of the S&P500 if it goes up, but you’ll always be protected if the value of the S&P500 drops.
However, in order to make up for the lack of the full return of the S&P500 I’m going to make all of your returns within the product tax-free. So instead of selling out of your position and paying taxes on the gains, I’m going to allow you to do all of this tax-free (although if you’re a long-term investor you shouldn’t really be selling into and out of the S&P500). I’m going to do this through a combination of allowing you to withdraw your basis tax-free and to take out loans against your gains at 4%-6% interest rates.
I’m also going to allow you to sell your position and invest in fixed income tax-free. So if you feel fixed income is going to deliver higher returns over the next few years than the S&P500, I’m going to allow you to invest in fixed income instead and then come back into the S&P500 when you’re ready. And there won’t be any taxes on going in and out like this.
Obviously, I’m going to have to charge you a fee for doing all this.
Let’s say that the net fee here for doing this for you is going to be 0.60% of your return.
Would that be worth it for you?
Before you answer that, you should rightfully ask me what the spread is going to be between the performance of the S&P500 and what’s credited to you.
To answer that I would say that it’s going to be a spread of 525 basis points less than S&P500 price return every 2 years.
And the reason I’m giving you the returns every 2 years is in order to keep the cost of the options lower and give you more of the upside (if I credited you what the S&P500 price returned every year the spread would be a lot higher than 525 basis points since the cost of the options are more expensive).
Let’s look at an example.
Let’s assume the S&P500 does 25% the first year and 10% the second year.
What do the 2 Year total returns and price returns with a 0% floor and a 525 basis point spread look like?
Let’s assume that the dividend return of the S&P500 is a constant 2.00%. So the price return for our purposes will just be 2.00% less than the total return.
The table below helps us answer our question.
Table 3: S&P 500 2 Year Price Return with a 5.5% Spread

The table above shows what we would expect.
In the first year (Column A), the S&P500 total return is 27% so the S&P500 price return is only 25% after we subtract the 2% dividend return.
In the second year (Column B), the S&P500 total return is -5% so the S&P500 price return is -7% (after subtracting the 2% dividend return).
We can see the total return after 2 years in Column C. For the S&P500 Total Return we see that the total return is 20.65% while the total price return is 16.25%.
Subtracting the 525 basis points from the 16.25% gets us at 11.00% for the 2 Year Price Return After the Spread and 0% floor.
Column D is the mean return while Column E is the compound annual return. As expected the volatility reduces the long-term return compared to the mean return.
What inferences can be drawn from the above example?
None.
It’s merely one example that merely illustrates how the product works but doesn’t account for the effect of taxation or the 0.60% fee or the fact that real life returns won’t be exactly like our example.
In order to understand this we need to do our Monte Carlo simulations.
But before we get to that, it’s important to understand the importance of taxation.
S&P500 Fund and Taxation
For those who don’t know, a low cost S&P500 fund like Vanguard’s VOO is extremely tax-efficient. It has a low turnover rate which doesn’t expose clients to a lot of taxation since it’s not constantly selling in and out of positions. The main taxation element for buy and hold investors comes from the dividend return (which we were assuming is 2% in our modeling).
For example if I buy a share of Apple and it makes 10% a year with no dividend payments, I’ll only pay taxes on the gains when I sell.
However, in retirement I need income and am forced to sell to meet my income needs (unless I’m using securities based loans which I’ll talk about in another post).
So while the S&P500 fund may be tax-efficient in and of itself, when I sell in retirement for income purposes I introduce taxation.
While this taxation is low for average Americans, it’s high for those who make high incomes—particularly for those in states like California, New York, and New Jersey that assess high state taxes on top of the federal taxes that all Americans pay.
For example in California, the highest earning residents pay over 38% on their long-term capital gains taxes (and over 50% on their bond gains).
Table 4: Understanding the Impact of Taxation
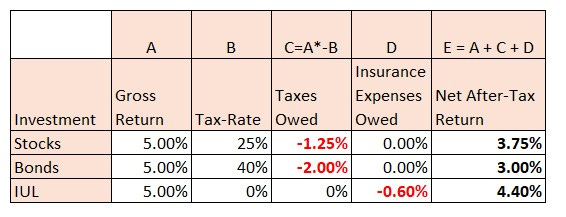
So vehicles like Roth IRAs or IULs that help them withdraw income while avoiding the taxation on them can be useful tools to avoid the 30%-40%+ taxation high income individuals will pay on their gains which is a drag on their returns just like volatility is.
And part of the play with the IUL in addition to reducing volatility in the portfolio is that the 0.60% net fee that is being charged here on the account value is significantly less than the taxes that would be owed if the client was selling the assets and paying taxes on them.
Case Study
So let’s take a look at a quick case study. We have a 50 year old married couple in California making $400k every year and are planning on retiring at 65 where they will need $400k in income to meet their spending needs (plus inflation). This will amount to about a 4% withdrawal rate. They are projected to pay 28% in capital gains and 33% in ordinary income on their gains from their portfolio.
Let’s assume that they’ll live to 90. Which would be a 40 year investment horizon (25 years post retirement at age 65).
Should they use a 100% Stock Portfolio, a 100% Bond Portfolio, a 60% Stock/40% Bond Portfolio or an IUL to help them meet these goals?
The table below helps us answer this question.
Table 5: Evaluating Retirement Portfolio Options
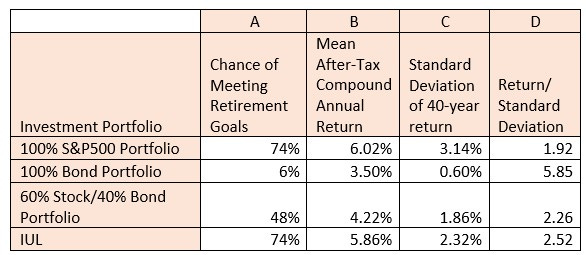

In the above table we see that the client’s best chance of meeting their retirement goals come from the 100% S&P500 portfolio and the IUL which both have a 74% chance of meeting the retirement income goals of the client. This makes sense given the higher earning potential and low taxation of equity markets that we mentioned previously.
The 100% bond portfolio on its own is too low earning to support a 4% withdrawal rate—especially when we account for the heavy taxation the client will face here which is why the chance of meeting the client’s retirement income goals drop from 74% to 6%. It’s worth noting that the standard deviation of the 40 year return here (Column C) is lowest for the bond portfolio which leads to it having the highest risk-adjusted return (Column D).
Speaking about volatility and risk-adjusted returns, it’s worth noting how much lower the volatility is around the 40 year returns in Column C than they were in Table 1 when we were looking at the annual volatility. In other words, if you can invest for the long-run, things become a lot less risky than if you’re only investing on a year-to-year basis.
The 60% Stock/40% Bond portfolio doesn’t improve the outcomes here over the 100% S&P500 Portfolio. The low return and high taxation of the bond portfolio significantly reduces the growth of the portfolio such that it is not enough to support the 4% withdrawal rate and the chance of meeting the client’s retirement income goals drops from 74% to 48%.
The IUL in comparison doesn’t give up much in long-term return over the 100% S&P500 Portfolio (the after-tax return after 40 years is 5.86% compared to 6.02% for the S&P500). This makes sense when we consider that IUL is reducing the volatility drag we mentioned above and protecting the client from being taxed at 30% on the gains from their withdrawals.
In other words, the 0.60% cost (which is a little more than 10% of the return here) is more than worth the value being added to the client in the form of reduced volatility drag and 33% tax savings.
The IUL as a Retirement Planning Tool
The point I’m trying to get at with all of this is to show you how advantageous financial and strategic planning can be—particularly for individuals in high tax brackets.
As we showed above (and in the table below), for these individuals who are planning to take out money in retirement, it makes a lot more sense to solve for that problem using an IUL than it does to put them in a 60/40 portfolio.
To be even more optimal, clients would replace part of the bond side of the portfolio with the right IUL product, while keeping the equity side. Then in retirement they would draw down on the IUL product for retirement income while allowing the tax-efficient, equity side to compound to a greater extent than if it was being drawn down on for retirement income.
That way clients are benefitting from being able to stay invested in tax-efficient equity positions for the long-term while utilizing the IUL for retirement income.
Improving Risk-Adjusted Returns through Proper Planning

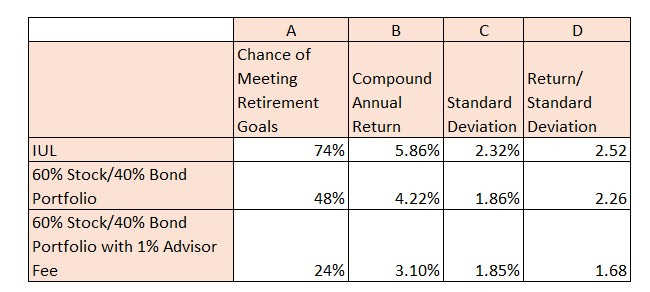
But most advisors don’t use an IUL like this because they can’t charge their 1% fee on an IUL product, but they can charge it on a 60/40 portfolio.
So financial advisors are not only providing high income earning clients with a worse solution, they are charging them an ongoing fee that compounds this problem.
Table 6: IUL vs 60/40 Portfolio with 1% Advisory Fee
Selling Simplicity vs Profiting off Nuance
And so ultimately the “horrible” IUL salesman everyone complains about and the financial advisor who is supposed to be acting as a “fiduciary” are both selling mathematically ineffective solutions.
The only difference is that one is selling an extremely expensive product that the client will lose money on the front-end while the other is selling an ineffective solution that the client will lose money on on the back-end.
But they both understand that simplicity sells.
People want to be sold and comforted by their decision and to believe everything can be boiled down to a simple decision process.
Is the financial advisory solution or the IUL policy they bought optimal?
Most likely not.
Is it better than them doing nothing?
Perhaps.
Do they feel better about their decision after they make it?
Absolutely.
Buyer’s remorse only seeps in later.
So yes, there is money to be made in both selling simplicity and buying it and not doing everything optimally.
But there’s also money to be made in understanding nuance and complexity and the framework of the systems we’re a part of.
In the example above, I didn’t just pick any generic IUL product.
I cherry picked one of the best IUL products I as an actuary have seen.
Most IUL products, have expense ratios in the 1.2%-1.5% range. This product was 0.60%.
It also allowed for a 2 year crediting option instead of a 1 year point to point strategy. This allowed for more economic upside (For those interested in the specifics of this product, I’ll break it down in my next post).
I then took what the clients were already investing in as part of their retirement strategy (stocks and bonds) and showed them how they could do this more effectively to manage both volatility and their high tax brackets.
So yes, most people will get the worse end of the deal from purchasing an IUL product.
And like I alluded to at the beginning, if you’re not in a high marginal tax-bracket retirement (32%+) and expect to be in one post retirement with a lot of liquidity and the ability to stay invested for 15 plus years and incorporate this as part of a retirement strategy, then you shouldn’t be touching any IUL product.
For most people who don’t meet this criteria, the guaranteed lifetime income annuity which I’ve written about in a previous post is a much better fit.
But if you do meet these criteria, then there are opportunities here to do what you’re already doing just more prudently.
But it requires effort, accountability, and planning on the consumer’s part.
Do we want to be sold simple solutions that appeal to our emotional needs more than rational judgment?
Because doing so opens us up to charlatans more than it does good faith advice.
Or do we want to check our biases and how we feel about the validity of insurance products as financial solutions and understand how we can use them as part of our overall wealth management strategy?
This is what “Separating Value From Bias” is about.
It’s understanding the nuances behind the tax, legal, behavioral economic, and sociological systems we’re a part of and prodding us to dig deeper than surface level conclusions.
About the Author
Rajiv Rebello is the Principal and Chief Actuary of Colva Insurance Services and Guaranteed Annuity Experts. He helps HNW clients implement better after-tax, risk-adjusted wealth and estate solutions through the use of strategic planning and life insurance and annuity vehicles. He can be reached at rajiv.rebello@colvaservices.com.
You can also book a call directly with him here: